Faculty
Compensation: main source of growth in municipal spending
May 12, 2015
Close to half the increase in per capita municipal spending in Quebec can be attributed to rising payroll expenditures, making this the main source of growth in municipal spending in Quebec from 2009 to 2013. This is one of the main findings of the report entitled Tendances et perspectives – Palmarès des municipalités du Québec, édition 2015 (2015 Quebec Municipalities Rankings) compiled by the HEC Montréal Centre for Productivity and Prosperity (CPP).
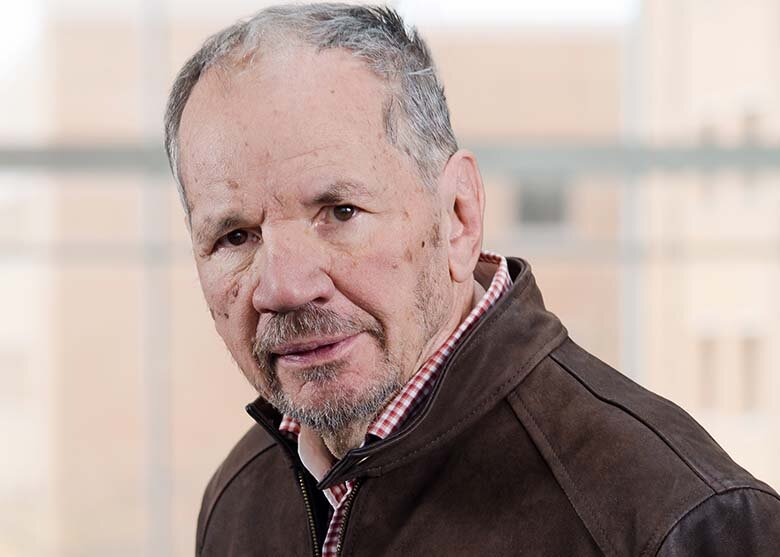
“The study covers five fiscal years, allowing us not only to see how municipal spending evolved from 2009 to 2013, but also to identify the main trends,” says CPP Director Robert Gagné.
This third edition of the rankings shows that municipal spending has grown more quickly than Quebec government spending in recent years. “Between 2009 and 2013, per capita municipal spending was up by 4.2% per year. Given that per capita spending by the Quebec government rose by only 2.9% annually over the same period, and that the average annual inflation rate was 1.8%, there’s every reason to question the significant growth in municipal spending,” points out Gagné, co-author of the study.
Compensation in large cities accounts for a larger share
The rankings also point to a clear trend in municipal spending. While compensation is a major source of the growth in municipal spending across Quebec, the phenomenon is especially apparent in large municipalities. Between 2009 and 2013, over 60% of the growth in spending by municipalities with populations of 100,000 or more came from higher compensation. Remember that this budgetary item includes wages, payroll taxes and fringe benefits.
Montréal is at the top of the list in this respect. Between 2009 and 2013, more than three-quarters of the city’s increase in spending was attributable to the higher wages and fringe benefits paid to municipal employees. In Quebec City, the province’s second-largest city, just over one-quarter of the growth in spending came from higher compensation, or three times less than in Montreal.
A powerful tool for democratization
The Quebec Municipalities Rankings are designed to allow Quebeckers to know the costs of the services provided by their municipalities. At total of 1,110 municipalities were examined, 33 indicators were studied and over a million pieces of data were compiled. The result is that with just a few clicks residents can find out how much their own municipalities spend on such items as management, compensation, snow removal, roads, police and fire departments, sewers, recreation, drinking water distribution, and garbage and recycling collection and, most importantly, whether these costs changed significantly between 2009 and 2013.
“Our goal with this exercise is to equip Quebeckers so that where appropriate they can question the decisions of their municipal councils, in order to obtain quality services at the lowest possible cost,” Gagné says. In the end, we hope that by sharing municipal data and making it more widely understandable, we can help put the brakes on spending increases and improve practices.”
Interested in learning more about municipal expenditures in Quebec and drawing comparisons between towns? A new interactive tool (in French), available on CPP’s website, allows users to run queries and compare data.


